Filebeat and Java stacktraces: stop losing half the error
Open Kibana on a Java project freshly hooked up to Filebeat, search for
an error, and you will often find this sight: the first line of the
exception in one document, then forty orphan documents each containing a
lonely at com.example.... The stacktrace is there, but scattered -
impossible to read, impossible to count errors, impossible to alert on.
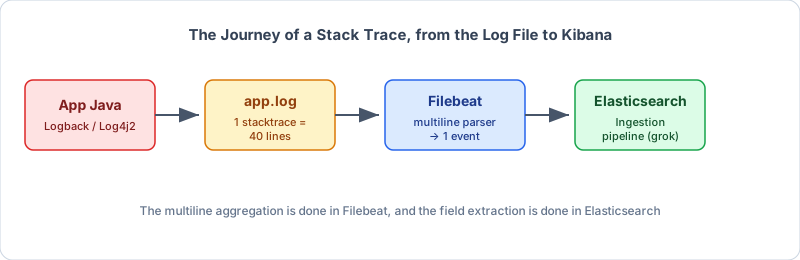
The cause is usually simple: Filebeat reads line by line, but a Java stacktrace spans multiple lines. Let’s see how to put the pieces back together, with a test application to verify every step.
The test application
To work on something concrete, here is a mini-application that logs normal traffic and throws an exception (which generates a stacktrace) every five seconds:
package fr.juery;

import org.slf4j.Logger;
import org.slf4j.LoggerFactory;

import java.sql.SQLException;
import java.util.UUID;

public class LogGenerator {
    private static final Logger log = LoggerFactory.getLogger(LogGenerator.class);

    public static void main(String[] args) throws InterruptedException {
        while (true) {
            log.info("Handling command {}", UUID.randomUUID());
            Thread.sleep(1000);
            try {
                loadCommand();
            } catch (Exception e) {
                log.error("Failed to handle command", e);
            }
            Thread.sleep(4000);
        }
    }

    static void loadCommand() {
        try {
            throw new SQLException("Connection refused: connect");
        } catch (SQLException e) {
            throw new IllegalStateException("Unable to load command", e);
        }
    }
}
With a classic Logback pattern:
<configuration>
    <appender name="FILE" class="ch.qos.logback.core.FileAppender">
        <file>./app.log</file>
        <encoder>
            <pattern>%d{yyyy-MM-dd HH:mm:ss.SSS} %-5level [%thread] %logger{36} - %msg%n</pattern>
        </encoder>
    </appender>

    <logger name="fr.juery" level="debug" additivity="false">
        <appender-ref ref="CONSOLE"/>
        <appender-ref ref="FILE"/>
    </logger>

    <root level="error">
        <appender-ref ref="CONSOLE"/>
        <appender-ref ref="FILE"/>
    </root>
</configuration>
The resulting file looks like this - note that only the first line starts with a date:
2026-07-19 15:09:56.923 INFO  [main] fr.juery.LogGenerator - Handling command af08c406-b83f-4973-b84a-da1b6803fbef
2026-07-19 15:09:57.931 ERROR [main] fr.juery.LogGenerator - Failed to handle command
java.lang.IllegalStateException: Unable to load command
	at fr.juery.LogGenerator.loadCommand(LogGenerator.java:29)
	at fr.juery.LogGenerator.main(LogGenerator.java:17)
Caused by: java.sql.SQLException: Connection refused: connect
	at fr.juery.LogGenerator.loadCommand(LogGenerator.java:27)
	... 1 common frames omitted
That is the property we are going to exploit: a line that does not start with a timestamp belongs to the previous message.
Step 1 - Filebeat’s multiline parser
Since Filebeat 7.16, the recommended input is filestream, and multiline
grouping is declared in the parsers list:
filebeat.inputs:
  - type: filestream
    id: demo-java-app
    paths:
      - /var/log/app/app.log
    parsers:
      - multiline:
          type: pattern
          pattern: '^\d{4}-\d{2}-\d{2}'    # A line that starts with a date...
          negate: true                     # ...DOESN'T match with this pattern ?
          match: after                     # concatenate it with the previous line
          max_lines: 200
          timeout: 5s

output.elasticsearch:
  hosts: ["https://elasticsearch:9200"]
The three options read together and are worth decoding once and for all:
patterndescribes the first line of an event (here: starts with aYYYY-MM-DDdate).negate: true+match: aftermeans: “any line that does not look like the start of an event is attached after the previous line”. That is the combination to remember for Java application logs - theat ...,Caused by:and... N common frames omittedlines never start with a date, so they get absorbed.max_lines(500 by default): beyond that, lines are dropped. 200 is more than enough for a stacktrace, even with threeCaused by.
Two classic pitfalls at this stage:
- Anchor the pattern. Without
^, a date in the middle of a message (“import of 2026-07-01 failed”) would trigger a bogus split. - The
timeout: if the application writes its stacktrace slowly (buffering, GC…), Filebeat waits for up to 5 s of silence before shipping the event. No need to touch it, but it explains the slight delay before errors show up.
After restarting Filebeat, each error lands in Elasticsearch as a
single document: the message field contains all 40 lines, complete
stacktrace included. First goal achieved.
Step 2 - extract the fields that make the document usable
A big blob of text in message is readable but not queryable. To filter
on log.level: ERROR or aggregate by exception class, the first line
has to be split into fields. Without Logstash, an Elasticsearch
ingest pipeline does the job very well:
{
  "processors": [
    {
      "grok": {
        "field": "message",
        "patterns": [
          "%{TIMESTAMP_ISO8601:app.timestamp} %{LOGLEVEL:log.level}\\s+\\[%{DATA:app.thread}\\] %{JAVACLASS:log.logger} - %{GREEDYMULTILINE:app.message}"
        ],
        "pattern_definitions": {
          "GREEDYMULTILINE": "(.|\\n)*"
        }
      }
    },
    {
      "grok": {
        "field": "app.message",
        "patterns": [
          "%{DATA:app.short_message}\\n%{JAVACLASS:error.type}(: %{DATA:error.message})?\\n%{GREEDYMULTILINE:error.stack_trace}"
        ],
        "pattern_definitions": { "GREEDYMULTILINE": "(.|\\n)*" },
        "ignore_failure": true
      }
    },
    {
      "date": {
        "field": "app.timestamp",
        "formats": ["yyyy-MM-dd HH:mm:ss.SSS"],
        "timezone": "Europe/Paris"
      }
    }
  ]
}
The second grok, flagged with ignore_failure, only applies to
messages that actually contain a stacktrace: it isolates the exception
class in error.type, its message in error.message and the stack in
error.stack_trace - the standard ECS field names, the ones Kibana and
alerting rules already know.
All that remains is to tell Filebeat to send documents through this pipeline:
output.elasticsearch:
  hosts: ["https://elasticsearch:9200"]
  pipeline: java-logs
Step 3 - verify the result
Before waiting on Kibana, test the pipeline with the _simulate API by
pasting a multiline event exactly as Filebeat sends it:
curl -X POST "localhost:9200/_ingest/pipeline/java-logs/_simulate" \
  -H 'Content-Type: application/json' -d '
{
  "docs": [{ "_source": { "message": "2026-07-19 15:10:02.944 ERROR [main] fr.juery.LogGenerator - Failed to handle command\njava.lang.IllegalStateException: Unable to load command\n\tat fr.juery.LogGenerator.loadCommand(LogGenerator.java:29)\n\tat fr.juery.LogGenerator.main(LogGenerator.java:17)\nCaused by: java.sql.SQLException: Connection refused: connect\n\tat fr.juery.LogGenerator.loadCommand(LogGenerator.java:27)\n\t... 1 common frames omitted" } }]
}'
The simulated document should come out with all the fields split:
{
  "log.level": "ERROR",
  "log.logger": "fr.juery.LogGenerator",
  "app.thread": "main",
  "app.short_message": "Failed to handle command",
  "error.type": "java.lang.IllegalStateException",
  "error.message": "Unable to load command",
  "error.stack_trace": "\tat fr.juery.LogGenerator.loadCommand(...)"
}
In Kibana, you can now write the queries that were impossible at the beginning:
log.level: "ERROR" and error.type: "java.lang.IllegalStateException"And above all, build a “top 10 error.type over 24 h” visualization -
the dashboard that reveals at a glance which exception is drowning the
logs.
The alternative that removes the problem: log in JSON
Everything above repairs a format designed for humans. The other school of thought is to produce JSON directly with ecs-logging-java:
<appender name="FILE" class="ch.qos.logback.core.FileAppender">
  <file>./app.log.json</file>
  <encoder class="co.elastic.logging.logback.EcsEncoder"/>
</appender>
Each event becomes a single JSON line - stacktrace included, escaped in
the error.stack_trace field. On the Filebeat side, no more multiline
or grok, just a simple ndjson parser:
parsers:
  - ndjson:
      target: ""
      overwrite_keys: true
If you own the application (its code), this is the best option: zero regex, zero risk of a pattern breaking at the next log format change. The multiline configuration remains essential for everything you don’t control - third-party applications, legacy systems, application server logs.
A stacktrace scattered across 40 documents helps no one. The trio of a
patternanchored on the timestamp +negate: true+match: afterreassembles the event in Filebeat; an ingest pipeline extractserror.typeanderror.stack_tracefrom it; and if you can modify the application, log in ECS JSON and remove the problem at the source.